
Page 7 - Services
P. 7
Overview of Industrial
Development
1 Output Value
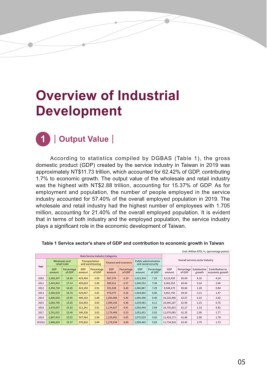
According to statistics compiled by DGBAS (Table 1), the gross
domestic product (GDP) created by the service industry in Taiwan in 2019 was
approximately NT$11.73 trillion, which accounted for 62.42% of GDP, contributing
1.7% to economic growth. The output value of the wholesale and retail industry
was the highest with NT$2.88 trillion, accounting for 15.37% of GDP. As for
employment and population, the number of people employed in the service
industry accounted for 57.40% of the overall employed population in 2019. The
wholesale and retail industry had the highest number of employees with 1.705
million, accounting for 21.40% of the overall employed population. It is evident
that in terms of both industry and the employed population, the service industry
plays a significant role in the economic development of Taiwan.
Table 1 Service sector's share of GDP and contribution to economic growth in Taiwan
Unit: Million NTD; %, (percentage points)
Main Service Industry Categories
Wholesale and Transportation Finance and insurance Public administration Overall services sector industry
retail trade and warehousing and social security
Year
GDP Percentage GDP Percentage GDP Percentage GDP Percentage GDP Percentage Substantive Contribution to
amount of GDP amount of GDP amount of GDP amount of GDP amount of GDP growth economic growth
2010 2,368,397 16.89 433,454 3.09 867,976 6.19 1,022,934 7.29 9,115,939 65.00 6.35 4.24
2011 2,443,843 17.14 405,824 2.85 909,011 6.37 1,040,552 7.30 9,362,353 65.64 3.16 2.06
2012 2,450,734 16.85 423,104 2.91 931,028 6.40 1,060,887 7.29 9,548,170 65.64 1.28 0.84
2013 2,560,534 16.78 429,057 2.81 970,475 6.36 1,044,892 6.85 9,851,750 64.54 2.21 1.47
2014 2,606,050 15.95 468,163 2.86 1,054,084 6.45 1,046,496 6.40 10,226,496 62.57 3.15 2.02
2015 2,664,745 15.65 516,593 3.03 1,099,345 6.46 1,039,481 6.11 10,546,107 61.95 1.23 0.76
2016 2,678,007 15.25 511,241 2.91 1,124,827 6.41 1,050,448 5.98 10,755,653 61.27 1.33 0.82
2017 2,781,031 15.40 546,338 3.03 1,178,408 6.53 1,052,851 5.83 11,076,085 61.35 2.90 1.77
2018 2,867,410 15.52 547,564 2.96 1,229,002 6.65 1,075,029 5.82 11,428,173 61.86 2.90 1.78
2019(r) 2,888,839 15.37 570,816 3.04 1,278,934 6.80 1,099,465 5.85 11,734,928 62.42 2.79 1.73
05